Analyzing Flood Risk of Schools in Dar es Salaam, Tanzania
Question:
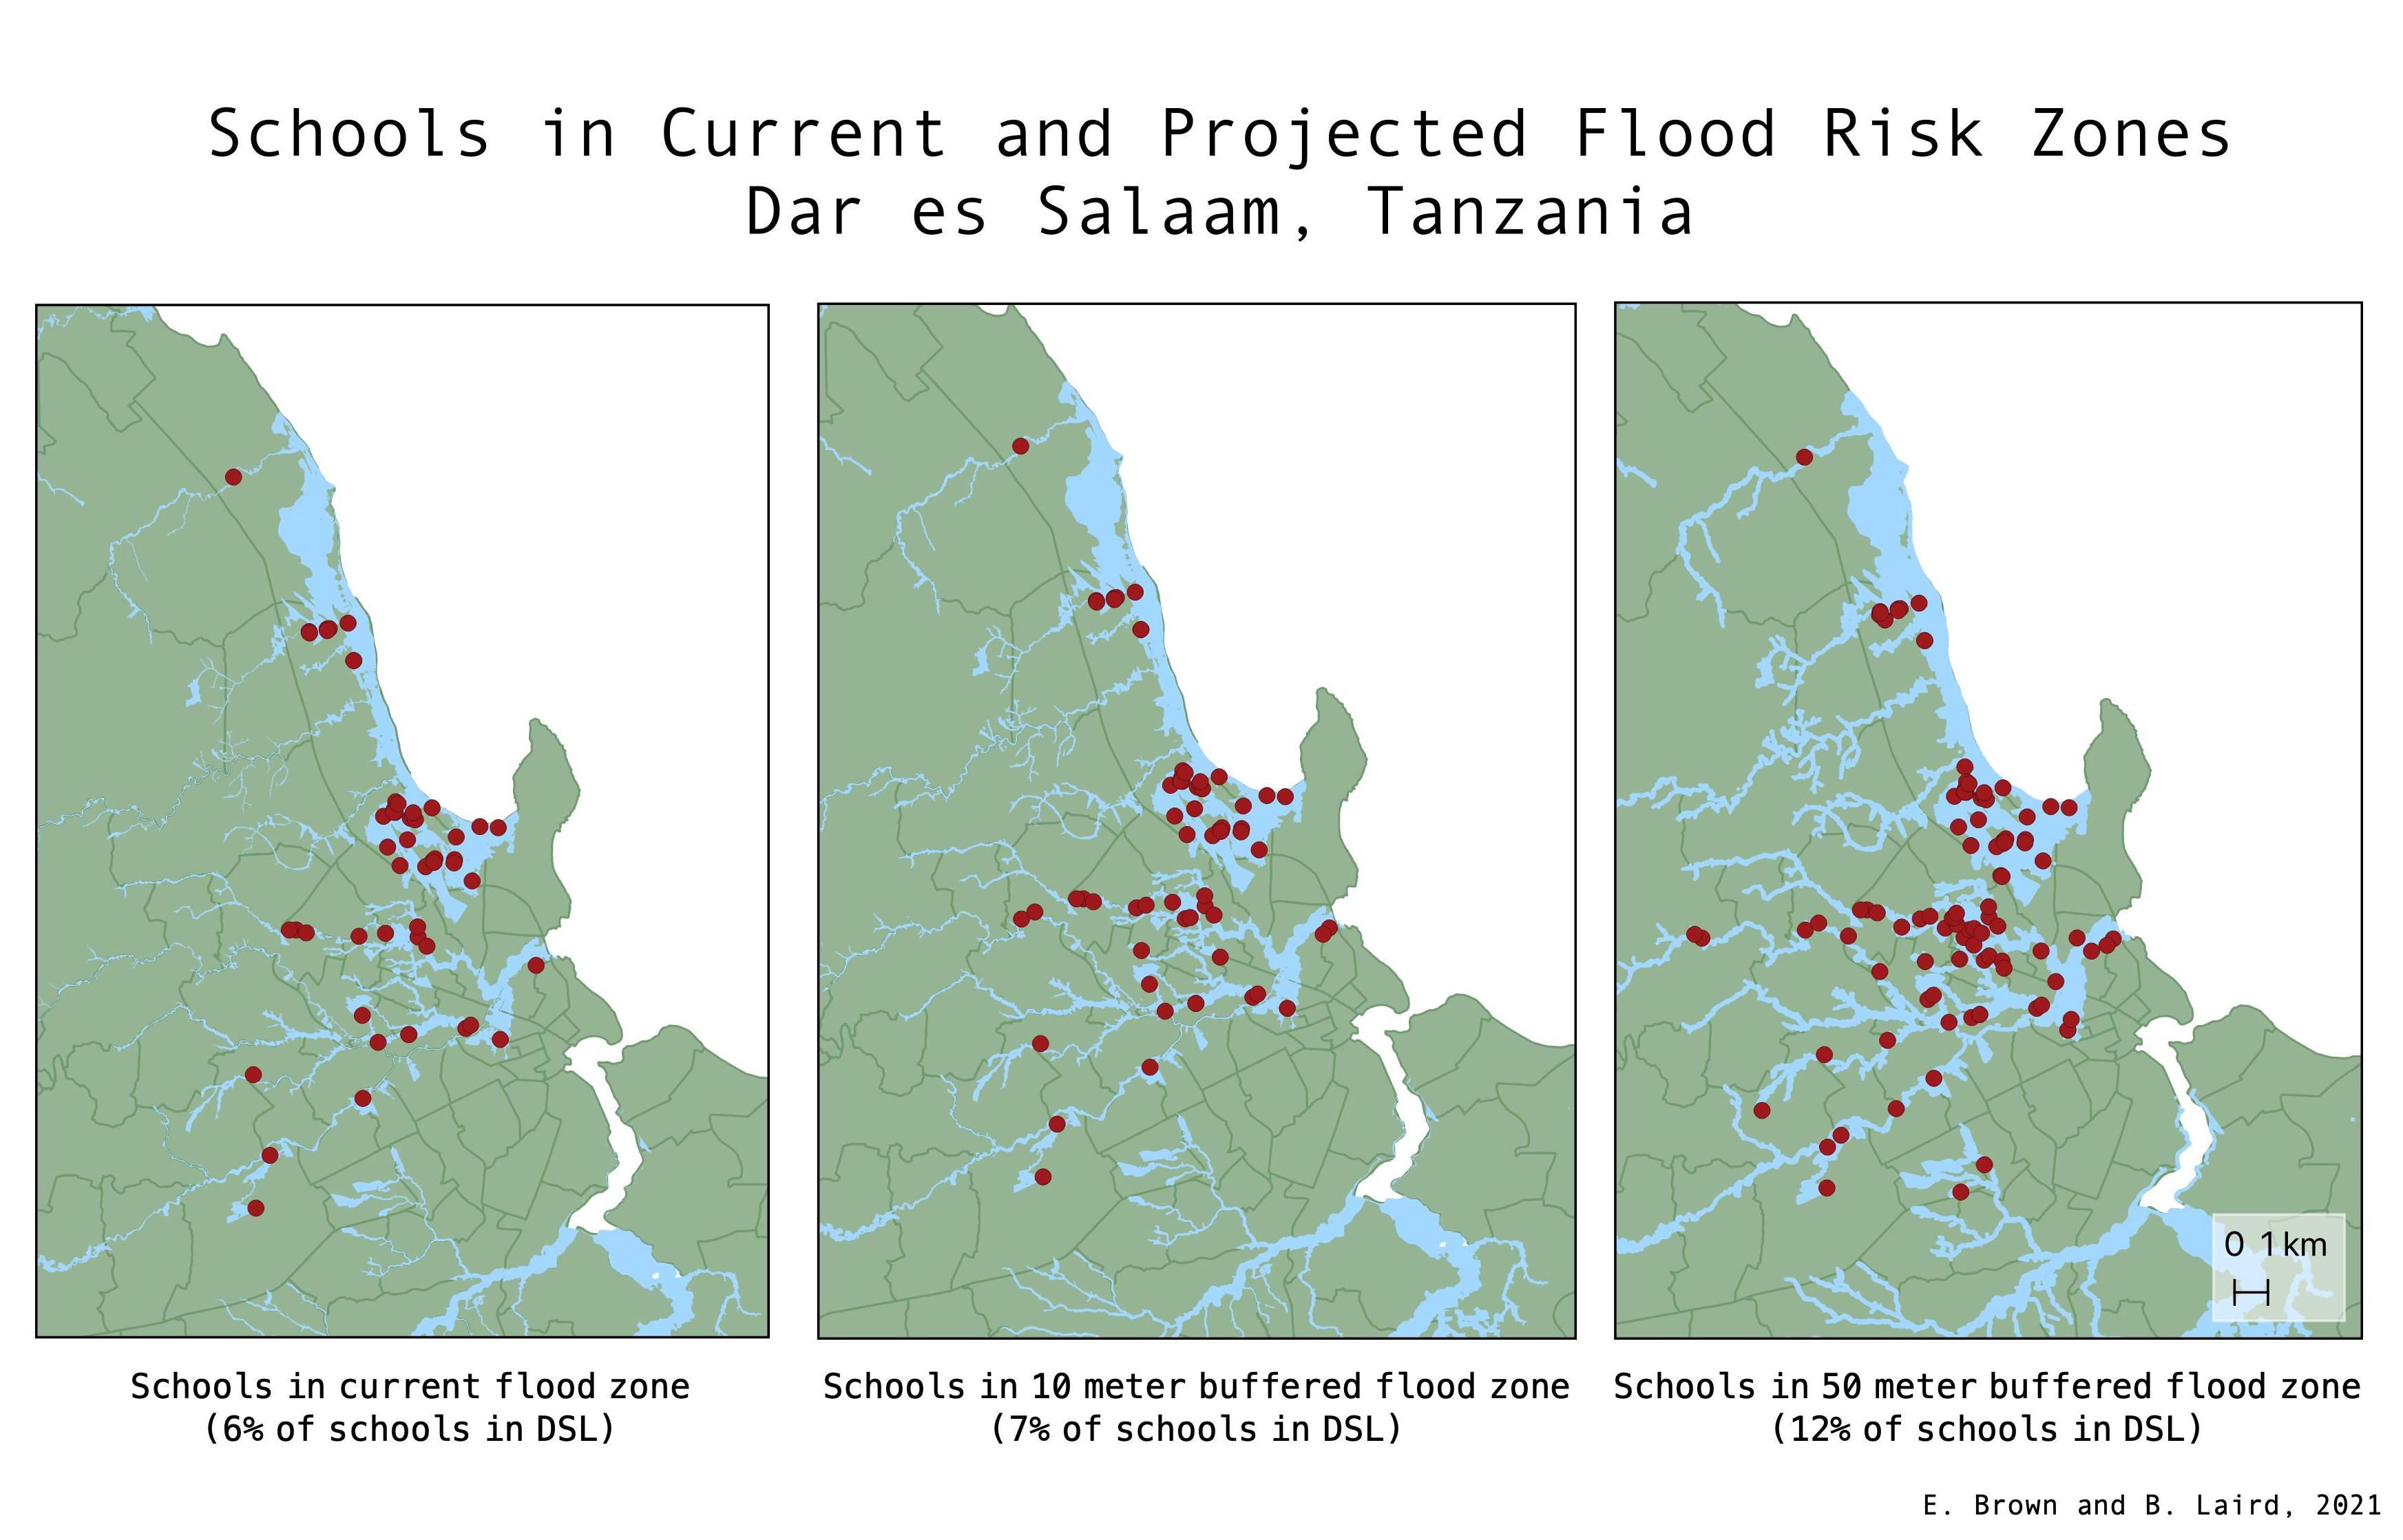
What schools are at risk of flooding in the city of Dar es Salaam based on current projected zones of flood Risk? How would flood risk to schools increase if the flood zones expanded by 10m or 50m?
Introduction:
Dar es Salaam, Tanzania’s economic center and fourth largest city, is incredibly vulnerable to floods due to its coastal nature and prominent rivers that dissect the city. Floods are especially dangerous to low-lying informal settlements that are often inhabited by low-income individuals. Not only does this pose health risks and infrastructural damage, flooding can affect schools and hospitals which then limits the services in these low-income areas. Further, climate change will only exacerbate this issue as flooding becomes more prominent and more dangerous.
Creating and maintaining equitable access to education is essential for planning resilient communities, especially in cities like Dar es Salaam where rapid urbanization and population growth is bringing in large numbers of new residents. We explored the flood risk of schools and universities within the city of Dar es Salaam, based on the location of flood zones determined by participatory mapping projects in the Resilience Academy.
While the flood vulnerability layer from the Resilience Academy is a useful starting off point for understanding the schools that may experience the most flood related risk, we also wanted to identify areas that could be considered vulnerable if the flood risk got more extreme. Models based on already existing flood data are useful, but in a community fighting back against increased rainfall, rapid urbanization, and coastal retreat, the use of models that consider potential projected risk help increase the potential for transformation and adaptation, instead of short term coping mechanisms. A report by the C40 Climate Leadership Group stated that the coastline of Dar es Salaam has retreated 200m in the past 50 years, and the city has experienced two extreme rainfall events in 2018 and 2019, resulting in the expansion of risk zones.
Flooding impacts school communities most directly through the potential for school shutdown, but also through other outcomes including building damage, potential health risks through the spread of disease, or the limitation of food and water resources that could have otherwise been distributed to children at school.
Methods:
The entire set of SQL queries for this analysis can be found here.
The first step was to use the open street map data to create a table of schools and universities in the city, as well as some following steps to clean up the data tables:
/* Creating a table of all schools and universities from polygon and point layer */
CREATE TABLE schools AS
SELECT amenity, st_centroid(way)::geometry(point,4326) as way , name, osm_id FROM planet_osm_polygon
WHERE amenity ILIKE 'school' OR amenity ILIKE 'university'
UNION
SELECT amenity, way, name, osm_id FROM planet_osm_point
WHERE amenity ILIKE 'school' OR amenity ILIKE 'university';

-- changing NULL names of schools to OSM ID
UPDATE schools
SET name = osm_id
WHERE name IS NULL
ORDER BY name ASC;

-- grouping by school name to get rid of duplicates, finding the centroids of schools with multiple buildings
CREATE TABLE school_centroids
AS
SELECT name, amenity, st_centroid(st_union(way))::geometry(point, 4326) as geom
FROM schools
GROUP BY name, amenity;
Next, we worked to prepare the flood data and a flood data column in the school centroids table. The flooded column will be updated with yes or no if the school centroid is at a flood risk. We created centroids for the schools because we noticed that some of the schools had multiple buildings, which we did not want to count as multiple different schools. Creating centroids created a central point to represent the school, if the school had multiple buildings.
-- adding column "flooded"
ALTER TABLE school_centroids
ADD COLUMN flooded text;
The intersection function is used to determine the schools that fall in the flood zones
-- updating flooded column if school is in flooded zone
UPDATE school_centroids
SET flooded = 'yes'
FROM flooddissolve
WHERE ST_Intersects(school_centroids.geom, flooddissolve.newgeom);
Next, we calculated the percentage of schools that are in the flooded zones based on the above intersection between the school centroids and the flood zone.
-- calculating percentage of schools in flooded zones
With tot as (SELECT COUNT(name) AS t
FROM school_centroids)
SELECT COUNT(flooded)/t::real as pctflood
FROM school_centroids, tot
WHERE flooded = 'yes'
GROUP BY flooded, t

SELECT COUNT(flooded) AS n
FROM school_centroids
WHERE flooded = 'yes'
GROUP BY flooded

SELECT COUNT(name)
FROM school_centroids
The end result from our first intersection showed us that 6% of the schools in Dar es Salaam are in the flood zone.
Now, we can create new buffers around the flood zone to see what would happen if flood risk was more severe.
--now lets see which schools might be impcated if the flooding was more severe
CREATE TABLE floodbuffer_one AS
SELECT st_buffer(geom, 10)::geometry(MultiPolygon,32737) as geom from flooddissolve;

CREATE TABLE floodbuffer_two AS
SELECT st_buffer(geom, 50)::geometry(MultiPolygon,32737) as geom from flooddissolve;

--create new columns in school centroids for new buffers
ALTER TABLE school_centroids
ADD COLUMN flooded_10 text;

ALTER TABLE school_centroids
ADD COLUMN flooded_50 text;
--schools impacted if flood zone grew by 10m
UPDATE school_centroids
SET flooded_10 = 'yes'
FROM floodbuffer_one
WHERE ST_Intersects(school_centroids.utmgeom, floodbuffer_one.geom);

--schools impacted if flood zone grew by 50m
UPDATE school_centroids
SET flooded_50 = 'yes'
FROM floodbuffer_two
WHERE ST_Intersects(school_centroids.utmgeom, floodbuffer_two.geom);


-- calculating percentage of schools in projected/ future flooding zones
With tot as (SELECT COUNT(name) AS t
FROM school_centroids)
SELECT COUNT(flooded_10)/t::real as pctflood
FROM school_centroids, tot
WHERE flooded_10 = 'yes'
GROUP BY flooded_10, t

With tot as (SELECT COUNT(name) AS t
FROM school_centroids)
SELECT COUNT(flooded_50)/t::real as pctflood
FROM school_centroids, tot
WHERE flooded_50 = 'yes'
GROUP BY flooded_50, t
The result of the two additional buffers, flooded_10 and flooded_50, tell us that 7% of schools would be at risk if the flood zone grew by just an additional 10m, and 12% at risk if it grew by 50m.
Results:
The spatial distribution of schools that are vulnerable to flood risk in Dar es Salaam can be found close to the coastlines, but also near the 4 rivers, part of the city’s fluvial system.
To further explore the spatial dimensions of flood risk in Dar es Salaam schools, you can access our interactive map.
While the Administrative Wards of Dar es Salaam are labeled on the map, and serve as a useful backdrop for understanding location of these school buildings, we choose not to evaluate risk based on schools per ward due to the nature of the education system in the city. Oftentimes students do not go to the school closest to them, so instead of grouping schools based on a spatial component we chose to focus on the individual projected risk of each building.
It is also important to recognize that creating centroids for the schools may have skewed the results a bit, and may not reflect the ground truth. Because some of the schools had multiple buildings which we did not want to count as multiple different schools, we chose to create centroids. However, because of this generalization, there may be instances on-the-ground where a school building is flooded, but the centroid is not. In this case, our analysis would indicate that a school is flooded, but in reality, not the whole school would be flooded. Contrarily, there is possibility that the centroid is flooded, but a school building is not. In the future, it would be beneficial to redo this analysis with this in mind.
Sources:
- Open Street Map
- Ramani Huria: a community mapping project for Dar es Salaam, Tanzania
- Resilience Academy
- Flooding in East Africa